Financial information
BASIC FINANCIAL INDEXES
| Specification | 2021 | 2020 | 2019 | 2018 | 2017 | 2016 | 2015 |
|---|---|---|---|---|---|---|---|
| PROFITABILITY | |||||||
|
Return on sales |
3,9% | 3,7% |
2,8% |
6,3% |
7,0% |
8,3% |
6,8% |
|
Profitability EBIT |
5,0% | 7,2% |
3,4% |
5,4% |
6,4% |
6,1% |
6,5% |
|
Profitability EBITDA |
7,7% | 9,3% |
4,4% |
7,2% |
7,9% |
8,0% |
8,8% |
|
Net profitability |
4,2% | 5,5% |
2,8% |
4,3% |
4,5% |
4,2% |
3,9% |
| LIQUIDITY | |||||||
|
General liquidity |
1,8 | 1,5 |
1,6 |
1,5 |
2,6 |
2,2 |
1,7 |
|
Accelerated liquidity |
1,8 | 1,5 |
1,6 |
1,5 |
2,5 |
2,2 |
1,7 |
| DEBT | |||||||
|
Total debt |
0,61 | 0,78 |
0,81 |
0,85 |
0,83 |
0,90 |
0,91 |
|
Net Financial Debt |
-2,49 | -2,30 |
-1,26 |
0,39 |
-0,18 |
-0,48 |
0,14 |
| EFFICIENCY OF ACTION | |||||||
|
Stock rotation (days) |
2 | 2 |
2 |
7 |
0 |
0 |
1 |
|
Debt turnover (days) |
113 | 165 |
106 |
133 |
94 |
120 |
133 |
|
Rotation of liabilities (days) |
121 | 175 |
98 |
134 |
62 |
75 |
109 |
Selected financial data
| Wybrane dane finansowe | 2021 | 2020 | 2019 | 2018 | 2017 | 2016 | 2015 |
|---|---|---|---|---|---|---|---|
|
Net Sales (Products, Goods, Materials) |
223 160 | 296 728 |
374 038 |
252 783 |
170 127 |
144 266 |
122 009 |
|
Operating Profit and Loss |
11 052 | 21 366 |
12 737 |
13 711 |
10 842 |
8 752 |
7 969 |
|
Gross Profit (Loss) |
11 308 | 20 304 |
12 035 |
12 787 |
10 207 |
7 987 |
7 255 |
|
Net Profit (Loss) |
9 454 | 16 231 |
10 650 |
10 534 |
7 694 |
6 111 |
4 701 |
|
Net cash flows from operating activity |
-14 984 | 31 352 |
30 578 |
-5 148 |
-862 |
9 875 |
26 132 |
|
Net cash flows from investment activities |
-3 028 | 11 636 |
-717 |
-999 |
-924 |
-2 499 |
-563 |
|
Net cash flows from financial activity |
-1 630 | -2 007 |
-8 679 |
5 168 |
-676 |
-15 340 |
-12 869 |
|
Net cash flows, total |
-19 642 | 40 981 |
21 182 |
-979 |
-2 462 |
-7 964 |
12 700 |
|
Total Assets |
164 456 | 249 964 |
202 926 |
192 009 |
100 211 |
91 701 |
86 103 |
|
Liabilities and Provisions for Liabilities |
101 313 | 195 300 |
164 686 |
164 174 |
82 922 |
82 133 |
78 699 |
|
Long-Term Liabilities |
1 268 | 654 |
14 401 |
25 882 |
872 |
636 |
949 |
|
Current Liabilities |
75 114 | 143 943 |
101 484 |
93 861 |
29 458 |
30 092 |
37 055 |
|
Shareholders' Equity |
64 143 | 54 664 |
38 240 |
27 835 |
17 289 |
9 568 |
7 404 |
|
Share Capital |
7 500 | 7 500 |
7 500 |
7 500 |
7 500 |
7 500 |
7 500 |
|
Number of Shares |
3 000 000 | 3 000 000 | 3 000 000 |
3 000 000 |
3 000 000 |
3 000 000 |
3 000 000 |
|
Profit (loss) per ordinary share (PLN) |
3,15 | 5,41 |
3,55 |
3,51 |
2,56 |
2,04 |
1,57 |
|
Book value of each share (PLN) |
21,38 | 18,22 |
12,75 |
9,28 |
5,79 |
3,19 |
2,47 |
|
Declared or paid dividend per share |
0,00 | 0,00 | 0,00 |
0,00 |
0,00 |
0,00 |
0,00 |


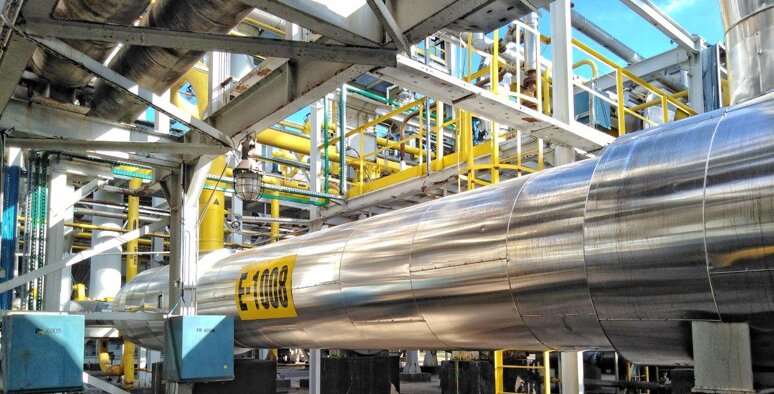 Gas Department
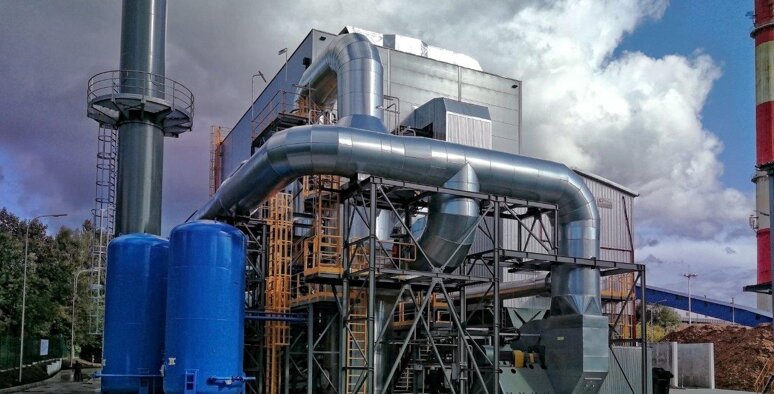 Cogeneration Department
 BOILER DEPARTMENT
 PIPING DEPARTMENT
 Construction Department
 Turbomachinery Department
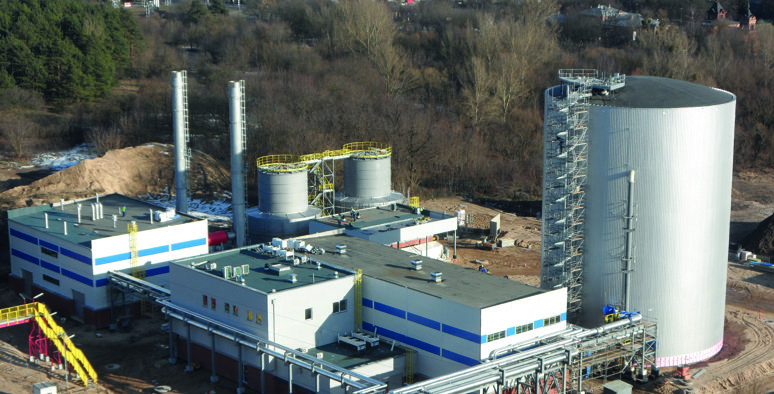 EPC Department
 Heat Treatment Department
 Export Department
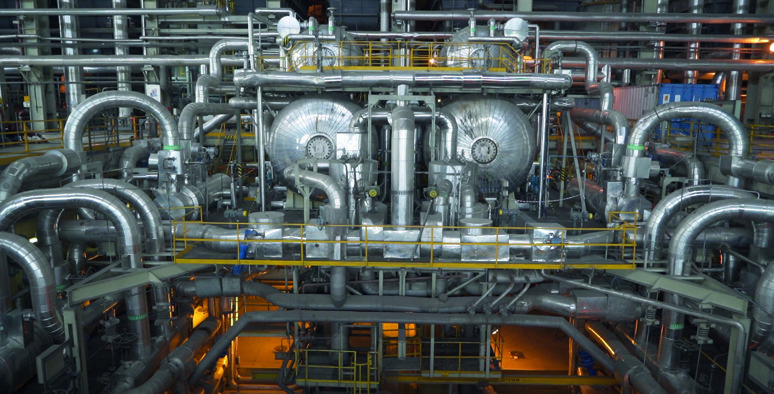 Department For System Commissioning
 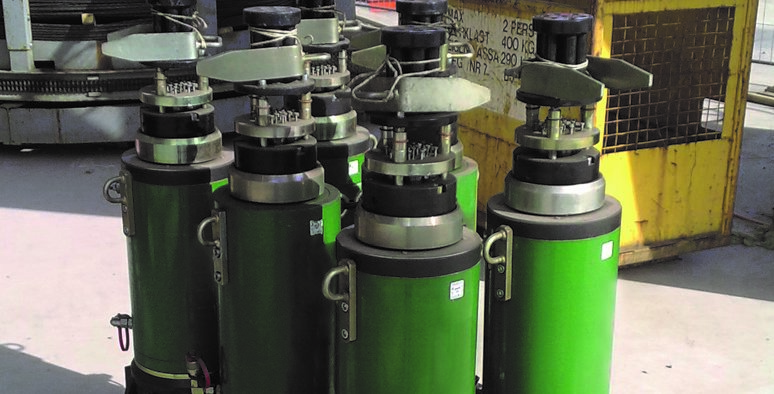 Department of Hydraulic Vertical Lifting System
 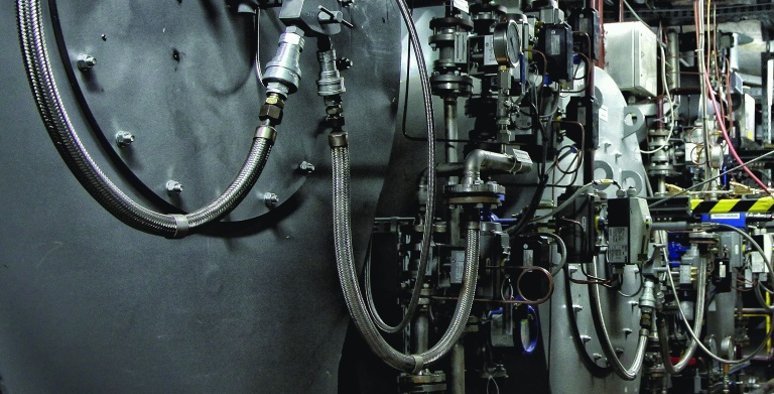 Non-Destructive and Destructive Testing Laboratory

